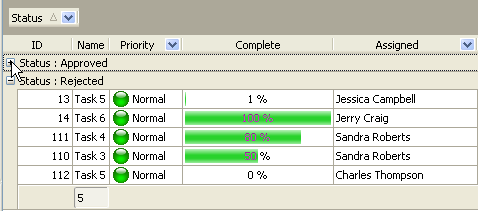
This key performance indicator shows the percentage %
and the amount of approved tasks against the number of tasks unapproved by
superiors or management in a project. This KPI helps to define how much projects
were successfully closed.
If you need to calculate the percentage (number) of approved
and unapproved tasks per project, please follow the steps below:
- Create your own workflow that would include statuses for approved
and unapproved tasks. As the example, your can use two-state workflow that
may be based on the following statuses: Approved – Rejected:
http://www.taskmanagementsoft.com/products/taskmanagerpro/tutorials/customization-guide/custom-workflow-53.php
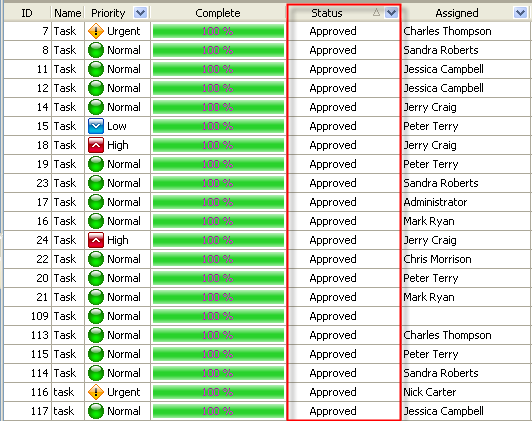
- To view the percentage
(number) of approved and unapproved tasks per particular project, filter
tasks by task group
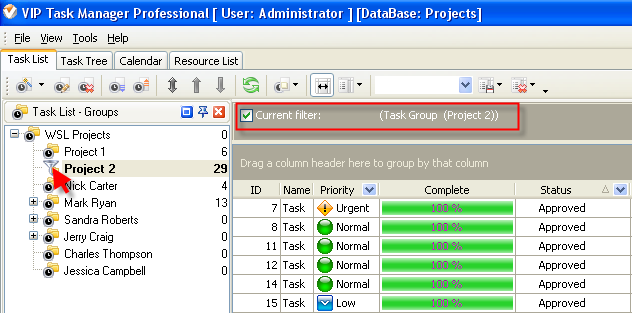
- If
you need to view the percentage (number) of approved and unapproved tasks per particular resource and/or over some time
span please set the appropriate filters on Task List – Filters panel
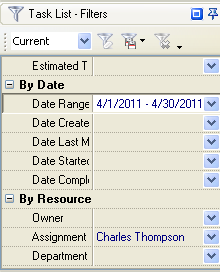
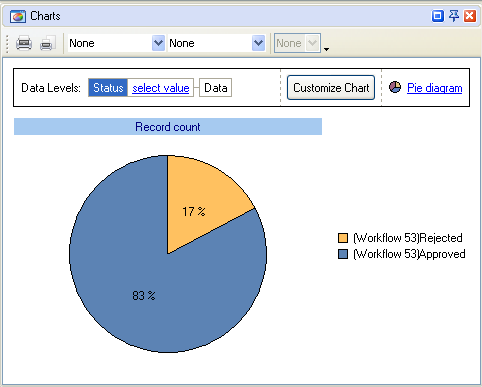
To view the percentage of approved or unapproved tasks please do the following:
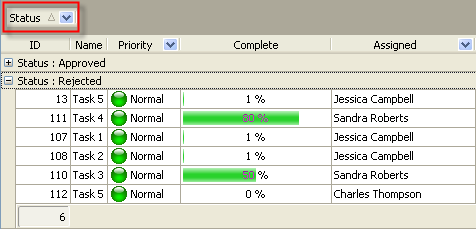
- to group tasks by Status drag and drop column header "Status" to
the top of your task list
- go to Charts panel and select "Pie diagram"
To view the number of approved or unapproved tasks per
project please do the following:
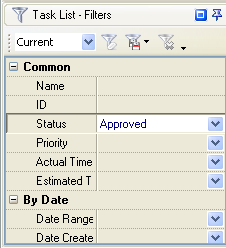
- set filter by required status
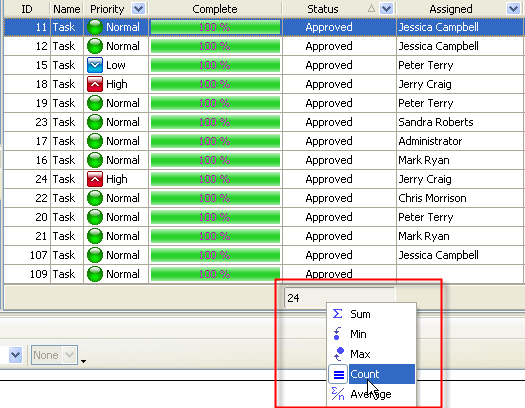
- right click under column "Status" and
select "Count"
Alternatively you can view the number of approved or
unapproved tasks if you group task
list by column "Status" and click "Expand All" button
