Total and Average Number of Quality Issues per Project is a measure used
for quality related projects, e.g. construction projects. Any issue that
affects the characteristics of a product or service provided in the way it
cannot meet upon-agreed requirements can be considered as Quality Issue. It can
be a defect, a deficiency, an incorrect information provided or any other issue
that results in rework, modification or acceptance of the product or service
with the quality issue. On this basis there are three types of Quality Issues:
1) Rejected Issue - when the quality of the product or service is so
poor that all work on it cannot be accepted and therefore must be redone
2) Reworked Issue - when a product needs to be modified to meet the
requirements.
3) Compromised Issue – when the responsible parties accept the product
or service with quality issue, defect, deficiency, etc. as it is
Total and Average Number of Quality Issues KPI shows the total and the
average number of all three types of quality issues listed above per particular
project and on all project stages as well as the percentage of each type of
quality issue against total number of all types of quality issues within a
project. Like any other measures of this kind Quality Issues KPIs should be the
metrics that show whether you satisfy your customers and their requirements.
If you need to calculate the percentage (number) of Quality
Issues, please follow the steps below:
- Create custom workflow with the Quality Issue types.
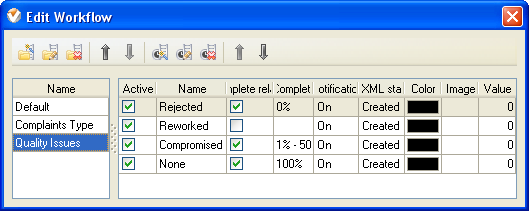
- Create custom field “Quality Issues Number”
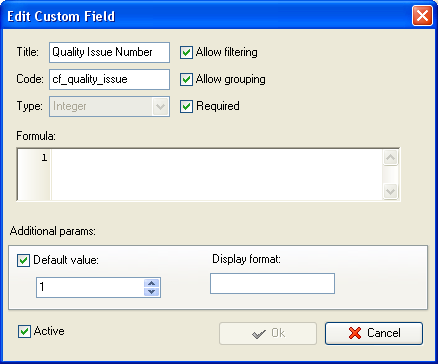
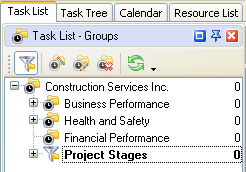
- If
you need to view the percentage % or number of Quality Issues of different
types per particular project, filter your to-do list by task group with
project tasks.
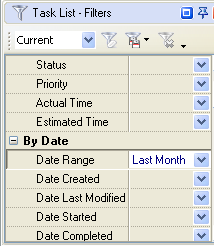
- If
you need to view the percentage % or number of invoices of Quality Issues
of different types per some time span, please set the appropriate filters
on Task List – Filters panel
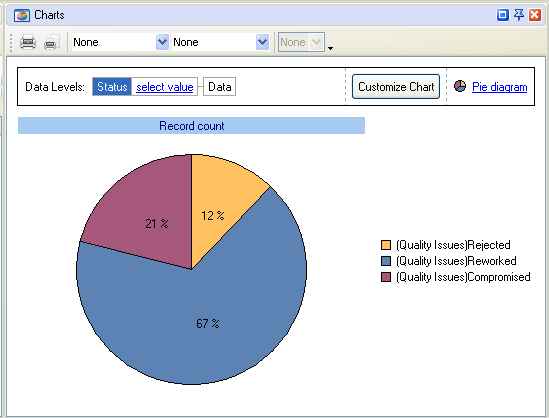
To view the percentage % of Quality Issues of
different types please do the following:
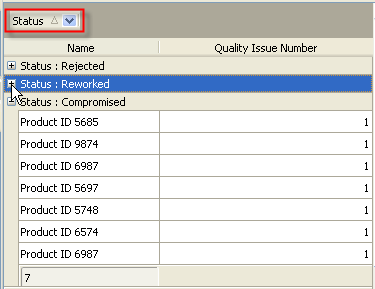
- to group tasks by Status drag and drop column header “Status” to
the top of your task list
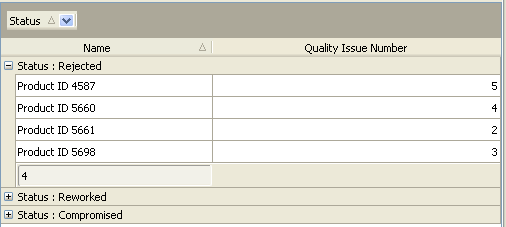
- go to Charts panel and select the required diagram type, for
example, “Pie diagram”
To view the number of quality issues by type please do
the following:
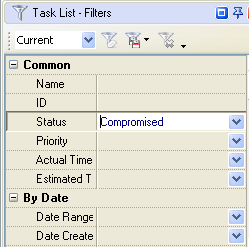
- Set filter by the type of Quality Issue: Rejected,
Reworked, Compromised
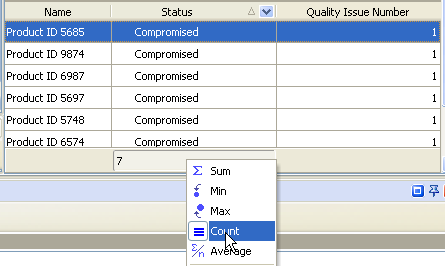
- to
set footer to display the number of quality issues of different types for a given project or to-do list right click under column “Status” and select “Count”
Alternatively you can view the number of quality issues of different types if
you group task list by column ”Status” and click “Expand All” button
- On Task Tree select the task group for which you need to display the
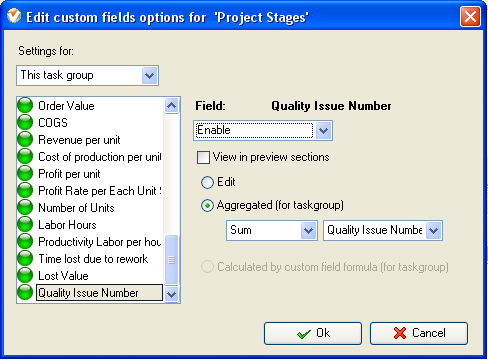
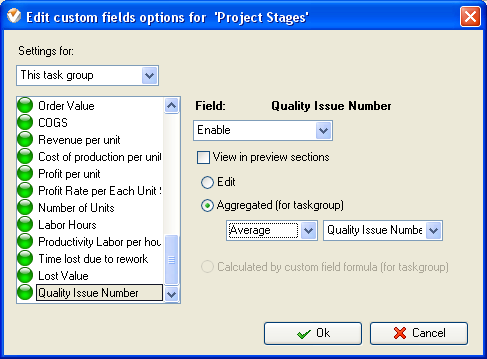
value of this KPI, select “Custom fields options” and set the following custom
fields settings for the custom field “Quality Issues Number”:
- In “Settings for” select “This task group”
- select “Enable”
- to display the total number of Quality Issues select “Sum” and the custom
field name “Quality Issues Number”
- to display the average number of Quality Issues select “Average” and
the custom field name “Quality Issues Number”
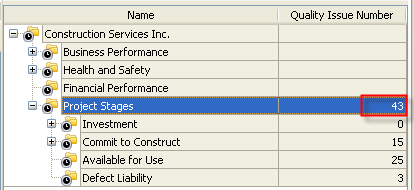
Total Number of
Quality Issues per Project on Task Tree
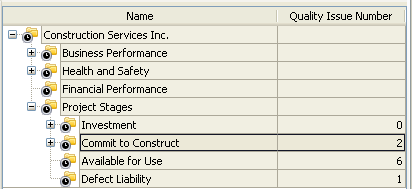
Average Number
of Quality Issues per Project on Task Tree
