|
Percentage (number) of Tasks with High, Normal and Low Priority per Assigned Resource
The given
key performance indicator shows the percentage % and the number of tasks with
different priority allocated per resource. This KPI helps to estimate the
resource load by tasks with different priority, in particular, determine if too
much tasks that should be done in the first place are assigned to each
resource.
If you need
to calculate the percentage (number) of tasks with high, normal and low
priority, per assigned resources please follow the steps below:
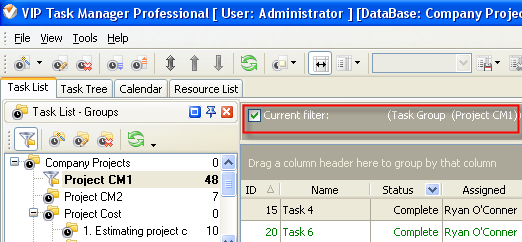
- If you need to view the percentage
(number) of tasks
with high, normal and low priority, per assigned resources
and particular project, filter tasks by task group
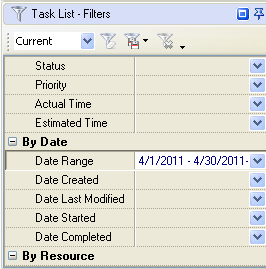
- If you need to view the percentage
(number) of open or closed tasks per assigned resource and/or over some
time span please set filter "By Date" on Task List – Filters panel
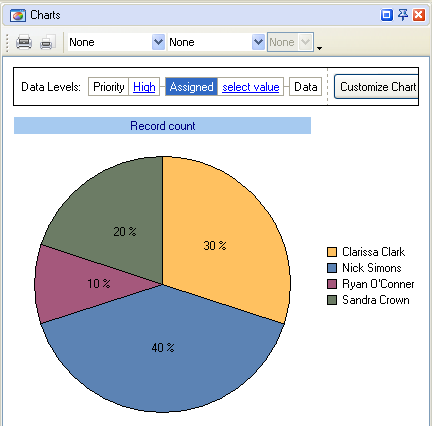
To view the
percentage of tasks with
high, normal and low priority, per assigned resources please follow the steps
below:
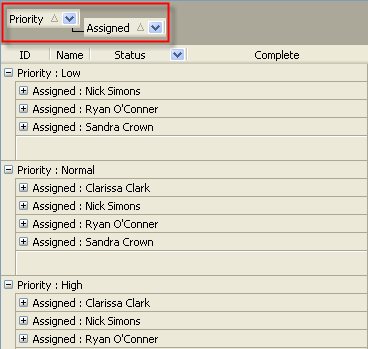
- drag and drop column header "Priority" and
"Assigned" to the top of your task list
- go to Charts panel and select "Pie
diagram"
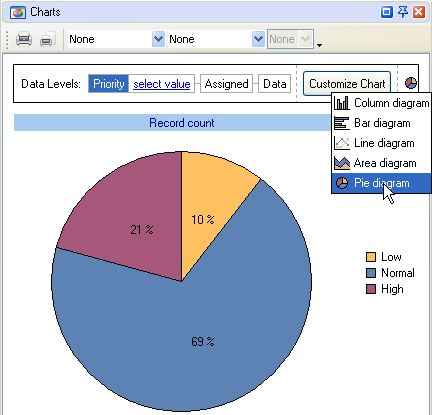
- to view the percentage tasks with high, normal and low
priority per assigned resources select the appropriate priority, for
example, "High"
To view the
number of tasks with
high, normal and low priority per
assigned resources do the following:
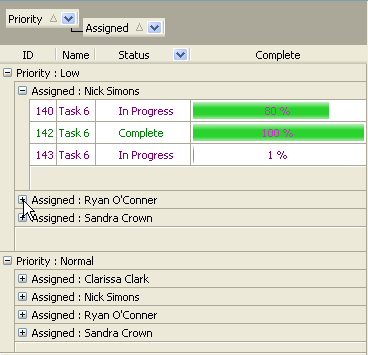
- group
your task list by columns "Priority" and "Assigned" and click "Expand All" button
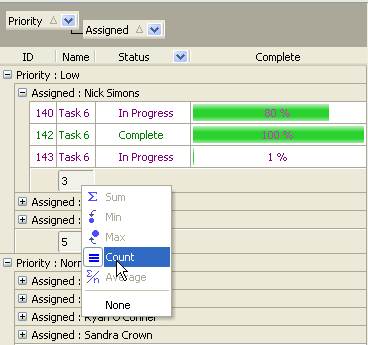
- Right click under column "Name" and select "Count"
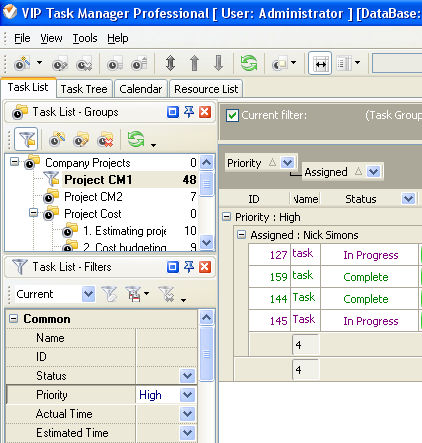
Alternatively you can filter task list by required resource and priority to
view the number of tasks with different "Priority-Resource" combinations.


|
 |
| » VIP Task Manager Pro |
| |
| |
| |
 |
|
